Catchment Health Dashboard
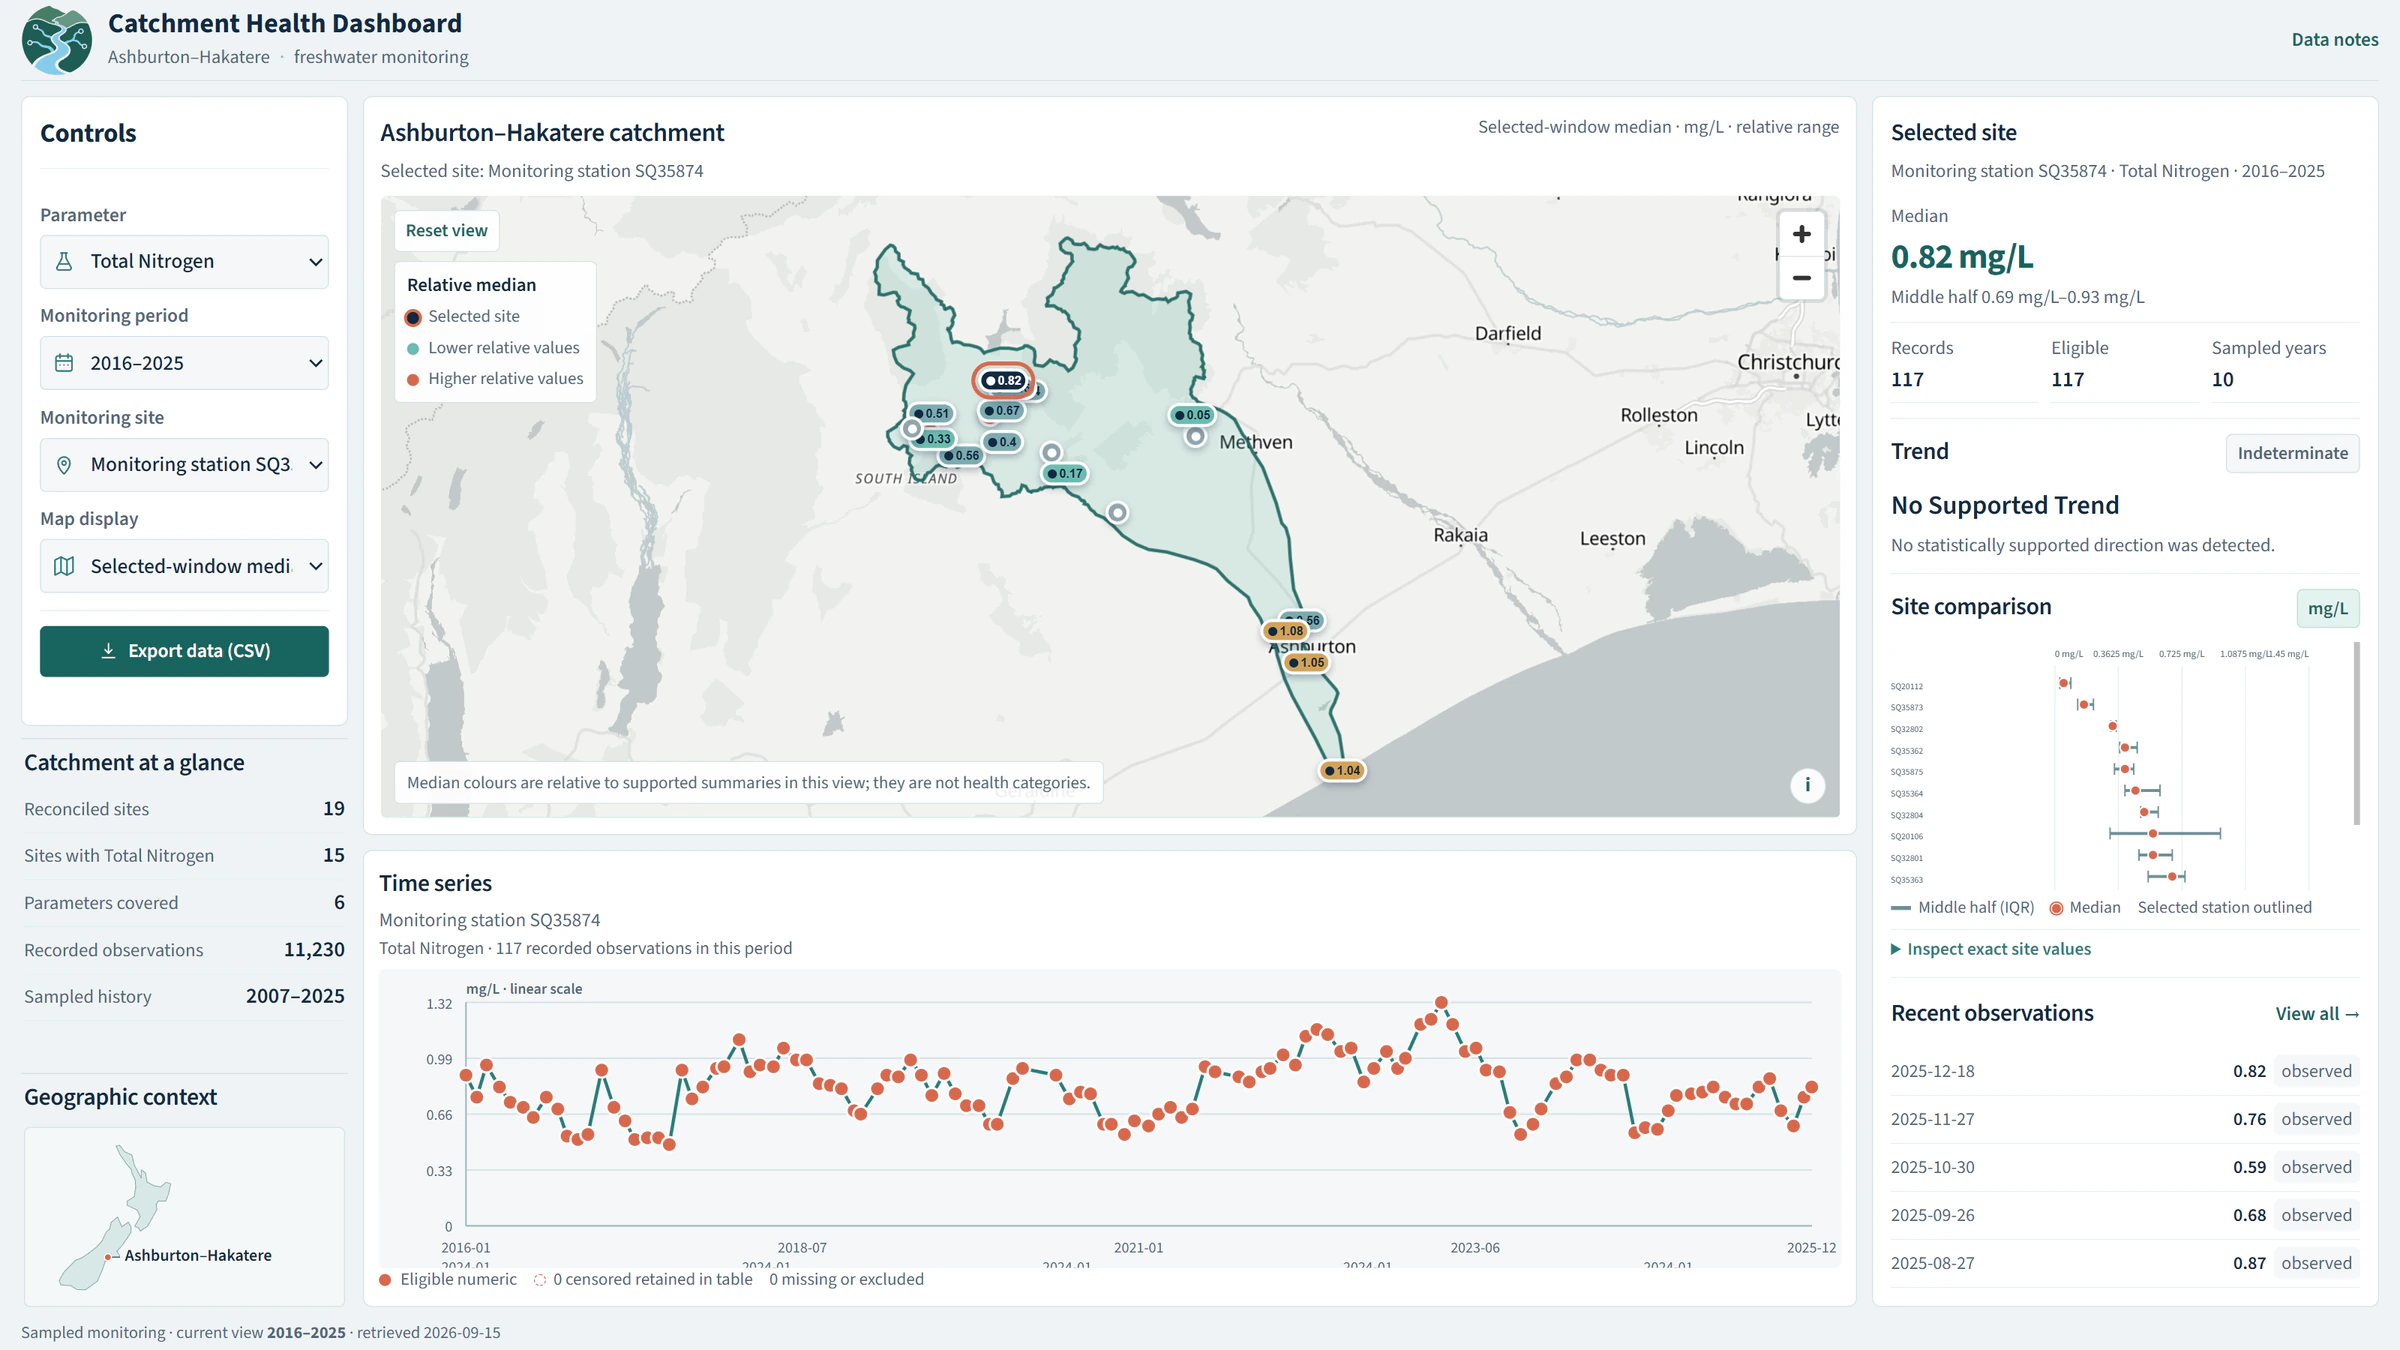
An interactive freshwater-monitoring dashboard for exploring water-quality observations and trends across the Ashburton–Hakatere catchment.
The question
How can freshwater monitoring observations be explored spatially and through time across the Ashburton–Hakatere catchment?
Approach
The dashboard organizes observations from 19 monitoring stations and makes station summaries, water-quality parameters and trends available through linked map and chart views. Parameters include E. coli, nitrate-nitrite, dissolved reactive phosphorus, total nitrogen, turbidity and dissolved oxygen.
Deliverable
An interactive environmental monitoring product with station exploration, trend analysis, map-linked historical charts and exportable data.
Technical implementation
Spatial data preparation and trend summaries are delivered through a React / TypeScript / MapLibre application designed for responsive map and chart exploration.
Data
- Freshwater monitoring observations
- 19 monitoring stations
- Water-quality parameter records
Limitations / methodology note
This is an environmental monitoring and exploration product. It does not make regulatory compliance determinations, and interpretation depends on the monitoring coverage, sampling history and available parameters.
Have a similar question?
Get in touch